-
- Back
-
- Back
-
- Back
-
- Back
-
- Back
-
- Back
-
- Back
-
- Back
Storytelling With Data Visualization
Storytelling With Data Visualization

Storytelling With Data Visualization
The Department of Training and Placement & Department of Electronics and Communication Engineering conducted a Guest Lecture on “Storytelling with Data Visualization” on 4 September 2021. Mr. Kapil Kushwaha, Nokia, Software, Chennai was the resource person.
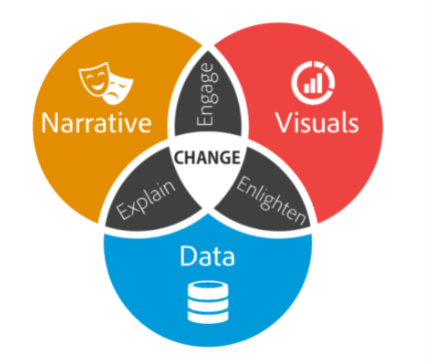
Mr. Kushwaha’s lecture briefly described about storytelling with data visualization which acts a bridge between data and human communication. Having the tools to process and analyze big data is great, but it is impossible for the human mind to process large numbers and understand the meaning behind them. Put simply, if an executive asks, “What do all these numbers mean?”, storytelling attempts to answer the question. It is important to note that data storytelling is not the same as data visualization. The visualization of data means presenting the findings in a diagram. By contrast, data storytelling attempts to build on the advantages of data visualization to increase our understanding of data.
For thousands of years, storytelling has been an integral part of our humanity. Even in our digital age, stories continue to appeal to us as much as they did to our ancient ancestors. Stories play a vibrant role in our daily lives—from the entertainment we consume to the experiences we share with others; to what we conjure up in our dreams. Modern day storytelling is often associated with the popular. Modern-day storytelling is often powerful delivery mechanism for sharing insights and ideas in a way that is memorable, persuasive, and engaging. For some people, crafting a story around the data may seem like an unnecessary, time-consuming effort. They may feel the insights or facts should be sufficient to stand on their own as long as they’re reported in a clear manner. They may believe the revealed insights alone should influence the right decisions and drive their audience to act. Unfortunately, this point of view is based on the flawed assumption that business decisions are based solely on logic and reason.
In fact, neuroscientists have confirmed decisions are often based on emotion, not logic. When you package up your insights as a data story, you build a bridge for your data to the influential, emotional side of the brain. When neuroscientists observed the effects detailed information had on an audience, brain scans revealed it only activated two areas of the brain associated with language processing: Broca’s area and Wernicke’s area. Mr. Kushwaha added the significance of Storytelling in form of video at the end of the session, the participants shared their feedback about the lecture.

